Tuesday, May 25, 2010

The Truth About Cursors: Part 3

In Part 2 of this series, I dangled a carrot in front of you, taunting you with the fact that the Reads and CPU figures were markedly different between SQL2008 and SQL2005 in processing our million-row test table one row at a time:

/*
Description CPU Reads
----------------------------------------------
SQL2008:
STATIC Cursor 23906ms 6,061,368
Emulating STATIC Cursor 23849ms 3,031,241 (Why is this half the reads???)
SQL2005:
STATIC Cursor 22378ms 6,107,958
Emulating STATIC Cursor 25402ms 6,128,352 (Reads are on par, but CPU higher)
*/
Why the heck is this? Doesn’t it seem a little weird that our T-SQL Code to emulate a STATIC Cursor only has half the Logical Reads of an actual STATIC Cursor? That’s what the figures show in SQL2008, but not in SQL2005.

I’ll take you now on my journey in trying to track this down.

Again, here is the code to create our million-row table:

if object_id('TestTable','U') is not null drop table TestTable
go
create
table TestTable
(
ID int identity(1,1) primary key
,Column1 varchar(50)
,Column2 varchar(50)
)
go

with
L0
(c) as (select 0 from (values (0),(0),(0)) x(c)) /* 3 Rows */
,L1(c) as (select 0 from L0 a,L0 b,L0 c) /* 27 Rows=3x3x3 */
,L2(c) as (select 0 from L1 a,L1 b,L1 c) /* 19683 Rows=27x27x27 */
,L3(c) as (select 0 from L2 a,L2 b) /* 387,420,489 Rows=19683x19683 */
,NN(n) as (select row_number() over (order by (select 0)) from L3)
insert TestTable (Column1,Column2)
select newid(),newid()
from NN
where n<=1000000
Let’s just examine the population phase of the cursor and our emulation. We’ll execute code to OPEN a STATIC cursor in clustered key order (ID), so that it does the population of its temporary table, and then just CLOSE it up again. And, in addition, we’ll execute T-SQL code that emulates that same population phase of the STATIC cursor:

/* STATIC Cursor Population */
declare c cursor local forward_only static read_only
for
select ID,Column1,Column2
from TestTable
order by ID
open c
close c
deallocate c

/* T-SQL Code to do the same kind of population */
if object_ID('tempdb..#CWT_PrimaryKey','U') is not null drop table #CWT_PrimaryKey
create table #CWT_PrimaryKey (SeqNo bigint primary key
,ID int
,Column1 varchar(50)
,Column2 varchar(50))
insert #CWT_PrimaryKey
select SeqNo=row_number() over (order by ID)
,ID=ID
,Column1
,Column2
from TestTable
And here is the Actual Execution Plan for those:

STATIC Cursor OPEN vs Manual INSERT

You’ll notice that they are exactly identical (except for the ROWCOUNT TOP operator that got thrown in the manual-population query)… Interestingly, the optimizer estimated the relative costs at 49%:51%, figuring the cursor had the edge.

But what are the Profiler figures for the two processes (in SQL2008)?

/*
Description CPU Reads Writes Duration
-------------------------------------------------------------
STATIC Cursor OPEN 5593ms 3,061,364 11,816 6844ms
INSERT #CWT SELECT 2188ms 29,814 12,375 9438ms
*/
Whoa! Wait a second here! The cursor generated 3 million reads and our manual INSERT only generated 30,000? And the CPU time for the cursor was more than twice that for the manual INSERT. (Despite all that, the STATIC Cursor still wins in terms of Duration time… go figure).

Logical Reads are counted when you SELECT rows from a table, but they are also counted when you INSERT rows into a table… especially a table with a clustered index, because it has to read pages in the index to determine where to insert each row, and it has to read the data page to put information about it into the Transaction Log. Both of our approaches read a million rows from our table, and they both created a million rows in a temporary table with a clustered index. Why the enormous difference in Logical Reads?

After doing some digging, I traced it down to this… Look at the Properties Window for the Clustered Index Insert Operator in our manual INSERT process:
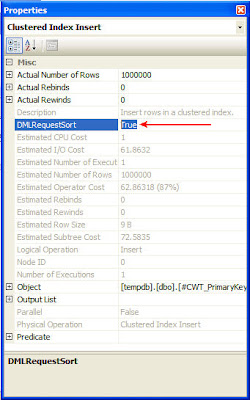
Clustered Index Insert Operator Properties Window

There’s this mysterious DMLRequestSort property and it’s set to True. On the other hand, the same Clustered Index Insert Operator in our Cursor plan has it set to False.

What if we didn’t INSERT those million rows into a temporary table whose name started with ‘#’? What if we just INSERTed into a table in TempDB that had a regular name that could be accessible by any other session?

if object_ID('tempdb..xCWT','U') is not null drop table tempdb..xCWT
create table tempdb..xCWT (SeqNo bigint primary key
,ID int
,Column1 varchar(50)
,Column2 varchar(50))
insert tempdb..xCWT
select SeqNo=row_number() over (order by ID)
,ID=ID
,Column1
,Column2
from TestTable
How does it compare with our other two approaches (in SQL2008)?

/*
Description CPU Reads Writes Duration
-------------------------------------------------------------
STATIC Cursor OPEN 5593ms 3,061,364 11,816 6844ms (DMLRequestSort=False)
INSERT #CWT SELECT 2188ms 29,814 12,375 9438ms (DMLRequestSort=True)
INSERT xCWT SELECT 8203ms 3,078,430 12,400 12938ms (DMLRequestSort=False)
*/
Well, isn’t that fascinating? It seems that SQL Server turns off the Logical Read count (via this DMLRequestSort property) when you are INSERTing into a temporary table (prefixed with ‘#’) clustered index. And it’s doing this because we are INSERTing the rows in the actual order of the clustered index (because we’re populating its primary key (SeqNo) with a ROW_NUMBER() function).

Take a look at the output from SET STATISTICS IO (which, by the way, doesn’t log as many reads as Profiler):

/*
STATIC Cursor:
Table 'Worktable'. Scan count 0, logical reads 3015959,...
Table 'TestTable'. Scan count 1, logical reads 11407,...
INSERT #CWT SELECT:
Table 'TestTable'. Scan count 1, logical reads 11407,...
INSERT xCWT SELECT:
Table 'xCWT'. Scan count 0, logical reads 3023334,...
Table 'TestTable'. Scan count 1, logical reads 11407,...
*/
All three approaches read from TestTable (11407 logical reads), and about 3 million reads are generated when INSERTing into the target table… but not for our INSERT into our temp table that’s prefixed with a ‘#’ character!! It doesn’t register any Reads in the target table whatsoever!

I couldn’t find anything in Books Online… or anywhere on the web whatsoever… about this DMLRequestSort property at all. The only two specific mentions of it were in a MSFT Connect Item Bug Report (the bug had to do with INSERTing into a table variable) and in a French SQL Forum (and that only existed because MVP David Barbarin posted it earlier this month to ask around about the property for me), but that was it… No information on what it is or what it indicates.

(Of course, now this article you’re currently reading will bring the specific web mention count up to three). 8^)

I suspected that it had to do with logging. Since the optimizer senses that we are inserting rows into the temporary table clustered index in order of the clustered index key, I figured it must somehow do it in bulk and minimally log it. It only does this with a temp table that is local to us (i.e. prefixed with ‘#’)… it does not do it for a table that can be accessible by another session.

But if that’s the case, then the cursor is getting shortchanged here, dontcha think? The CWT_PrimaryKey table that it populates is also a table that is local to us… it can’t be accessed by another session… heck, it can’t even be accessed directly by us, except indirectly via the FETCH command. It seems to me that it should be populated in bulk with minimal logging as well. But it’s not.

If my suspicions about minimal logging were correct, that would also explain why the CPU is lower in our manual INSERT code… minimal logging equals less CPU. And that’s why our emulation code always won in our tests in terms of Logical Reads and CPU time.

I wanted to do some more digging and convince myself that minimal logging was, in fact, occurring.

So I put together the following code to insert a quantity of rows into a temp table (prefixed with ‘#’) and then look at the Transaction Log (via the sys.dm_tran_database_transactions DMV) to see what got put into it:

/* How many rows shall we insert? */
declare @RowsToInsert int = 1000

/* Begin the transaction */
begin transaction

/* Create the table and Insert the requested number of rows */
if object_ID('tempdb..#CWT_PrimaryKey','U') is not null drop table #CWT_PrimaryKey
create table #CWT_PrimaryKey (SeqNo bigint primary key
,ID int
,Column1 varchar(50)
,Column2 varchar(50))
set rowcount @RowsToInsert
insert #CWT_PrimaryKey
select SeqNo=row_number() over (order by ID)
,ID=ID
,Column1
,Column2
from TestTable
set rowcount 0

/* Look at the Transaction Log data */
select database_transaction_log_record_count
,database_transaction_log_bytes_used
from sys.dm_tran_database_transactions
where database_id=db_id('tempdb')
and database_transaction_begin_time is not null

/* Close the transaction */
commit
I ran this for various quantities of rows from 100 on upward, recording the Transaction Log figures. And then I ran the same code, but this time for a table in tempdb without a ‘#’ prefix to its name.

Here is a chart showing Log Records created for various quantities of inserted rows from 100 to 1000:

Log Record Count for 100 to 1000 Inserted Rows

Both generated Log Records in a consistent manner for inserted rows up to 250. And then at 251 inserted rows, the Transaction Log Records count fell off a cliff for the table with a ‘#’ prefix. This is where the DMLRequestSort property kicked in… It was False when inserting 100 rows and for inserting 200 rows and for inserting 250, but when I inserted 251 rows (and any number above that), it turned to True, and the logging became minimal. It seems 251 rows is the “tipping point” for the rowsize of the data that I was inserting. It would be a different number of rows for other rowsizes… but I haven’t taken the time to figure out how that “tipping point” is calculated.

The same phenomenon continues… Here is a chart for inserted rows from 1000 to 10000:

Log Record Count for 1000 to 10000 Inserted Rows

And so on and so on and so on up to a million rows. When I insert 1 million rows into a temp table without a ‘#’ prefix, it creates 1,000,078 Log Records. But inserting rows into the temp table with a ‘#’ prefix never brings the Log Record Count higher than 400 or so.

So it looks like this DMLRequestSort=True phenomenon is a nice shortcut introduced in SQL2008 to cut down on logging and therefore Reads and CPU.

But it doesn’t get applied to STATIC (or KEYSET) cursors that create a temp table of data when they are OPENed.

Poor CursorsOnce again, the unfortunate cursors are shunned and are not invited to the optimization party.

Poor cursors… sniff

They always get the short end of the stick… sob


I sincerely hope you enjoyed this series on cursors.

Admit it… you probably hated cursors with a passion before you started reading the series, but then, as you grew to understand them and how they worked and performed in Parts 1 and 2, you gained a little bit of appreciation and respect for them, and now, at the end of this final installment in the series, you perhaps feel a little empathy and compassion towards them.

Right?

Well, if so, then my work is done…

…And there’s no need to mention the #&*@ things in my blog ever again.

Friday, May 21, 2010

The Truth About Cursors: Part 2

In Part 1 of this series, we looked under the hood at how various types of cursors worked and we found that their performance (if DECLAREd correctly) is not as horrible as many seem to believe.

In this article, Part 2, we will look at some more performance statistics, discovering some interesting things along the way. And we’ll end with a little mystery that will hopefully whet your appetite for Part 3.

Processing in Clustered Index Key Order

As you recall, in Part 1, we created a million-row test table with a clustered index primary key on the ID column:

if object_id('TestTable','U') is not null drop table TestTable
go
create
table TestTable
(
ID int identity(1,1) primary key
,Column1 varchar(50)
,Column2 varchar(50)
)
go

with
L0
(c) as (select 0 from (values (0),(0),(0)) x(c)) /* 3 Rows */
,L1(c) as (select 0 from L0 a,L0 b,L0 c) /* 27 Rows=3x3x3 */
,L2(c) as (select 0 from L1 a,L1 b,L1 c) /* 19683 Rows=27x27x27 */
,L3(c) as (select 0 from L2 a,L2 b) /* 387,420,489 Rows=19683x19683 */
,NN(n) as (select row_number() over (order by (select 0)) from L3)
insert TestTable (Column1,Column2)
select newid(),newid()
from NN
where n<=1000000
And we ran some tests in processing this table one row at a time, in clustered index key (ID) order, via various cursors and via various non-cursor-based T-SQL Code approaches. And these were the results of those tests (running in SQL2008):

/*
Description of Method CPU Reads Writes Duration
---------------------------------------------------------------------------
CURSOR Approaches (LOCAL FORWARD_ONLY):
STATIC READ_ONLY 23906ms 6,061,368 11,817 25068ms <--Winner
KEYSET READ_ONLY 36578ms 8,787,165 2,110 38158ms
DYNAMIC READ_ONLY 24270ms 1,011,368 0 29539ms
FAST_FORWARD READ_ONLY 24328ms 1,011,368 0 29632ms
Non-CURSOR Approaches:
Emulating STATIC CURSOR 23849ms 3,031,241 12,376 33659ms
Emulating KEYSET CURSOR 34297ms 6,020,084 2,608 39571ms
TOP 1 [Kind of emulates DYNAMIC] 20286ms 3,011,368 0 27137ms
*/
(Note: All of my tests were recorded in SQL2008 with a Profiler server-side trace with Query Results discarded. In addition, before each test, the procedure cache was cleared (DBCC FREEPROCCACHE) and the data buffer pool was cleared (DBCC DROPCLEANBUFFERS) so that they were all run against a completely cold cache.)

The STATIC cursor was the winner among all the tests in terms of Duration. If you strictly based the results on minimum Reads and Writes, then the DYNAMIC and FAST_FORWARD cursors were the winners. But if you used CPU time as your only measure, then the non-cursor approach of doing a TOP 1 was the winner.

Let’s review the code for that TOP 1 approach, which is our attempt to emulate a DYNAMIC cursor by retrieving one row at a time directly from the table itself:

declare @ID int
,@Column1 varchar(50)
,@Column2 varchar(50)
declare @CurrID int
select
@CurrID = -2147483648 /* Initialize to lowest possible ID */
while 1=1
begin
select top 1 @ID=ID
,@Column1=Column1
,@Column2=Column2
from TestTable
where ID>@CurrID
order by ID
if @@rowcount=0 break
/* We would do something with the data here */
select @CurrID=@ID /* Save Current ID */
end
The reason this worked so well is because we were accessing the data in clustered index key order.

Processing in Non-Clustered Index Key Order

Now what if we created a non-clustered index on Column1 in our table…

create nonclustered index IX_TestTable_Column1 on TestTable(Column1)
…and we wanted to access the data in order of Column1 and ID?

Well, now our TOP 1 approach is not so easy to implement. Even though we populated Column1 with NEWID(), which is supposed to generate unique values, we still have to account for the fact that Column1 may, in fact, have potential duplicates. In fact, let’s just go ahead and introduce a few duplicates:

update TestTable
set Column1=replicate('0',36)
where ID%100000=0
So now, out of our million rows in the table, we now know there are 10 rows that have a common Column1 value.

How would we attempt to emulate a DYNAMIC cursor with T-SQL code now?

Well, first of all, we would have to have 2 variables to house our current value of Column1 and current value of ID. And we could just change the WHERE clause of our TOP 1 query to the following:

declare @ID int
,@Column1 varchar(50)
,@Column2 varchar(50)
declare @CurrColumn1 varchar(50)
,@CurrID int
select
@CurrColumn1='' /* Initialize to lowest possible Column1 value */
,@CurrID=-2147483648 /* Initialize to lowest possible ID */
while 1=1
begin
select top 1 @ID=ID
,@Column1=Column1
,@Column2=Column2
from TestTable
where Column1>@CurrColumn1
or Column1=@CurrColumn1 and ID>@CurrID
order by Column1,ID
if @@rowcount=0 break
/* We would do something with the data here */
select @CurrColumn1=@Column1
,@CurrID=@ID
end
We have to account for the fact that the next row we need to access could potentially have the same Column1 value as our most recent @CurrColumn1 value, so we are forced to have a WHERE clause with an OR predicate. And, unfortunately, that brings about a SCAN of the nonclustered index, because OR predicates are not SARGable, as you can see in the Estimated Execution Plan:

TOP 1 Query with OR in Predicate

This will do a SCAN of our nonclustered index, looking for the first row it encounters (because of the TOP 1) that satisfies the WHERE clause. Then, when it gets that row, it will do a Key Lookup into the clustered index to get the Column2 value.

Remember, the above plan reflects what we will be doing a million times. The SCAN will be quick for the first several hundred iterations (because the next row will always be toward the beginning of the index), but when we are processing the 900,000th iteration, for example, the SCAN will have to trudge through 900,000 rows just to find our next row that satisfies the query. This will take a loooonnnnggg time.

So we have to use a different approach. We will have to do it in two steps. First, we’ll look for the TOP 1 row that has the same Column1 value as our last one, but with a higher ID. If we fail to find a row that satisfies that, then we’ll look for the TOP 1 row that has a greater Column1 value as our last one. Here’s what that looks like:

declare @ID int
,@Column1 varchar(50)
,@Column2 varchar(50)
declare @CurrColumn1 varchar(50)
,@CurrID int
select
@CurrColumn1='' /* Initialize to lowest possible Column1 value */
,@CurrID=-2147483648 /* Initialize to lowest possible ID */
while 1=1
begin
select top 1 @ID=ID
,@Column1=Column1
,@Column2=Column2
from TestTable
where Column1=@CurrColumn1 and ID>@CurrID
order by Column1,ID
if @@rowcount=0
begin
select top 1 @ID=ID
,@Column1=Column1
,@Column2=Column2
from TestTable
where Column1>@CurrColumn1
order by Column1,ID
end
if @@rowcount=0 break
/* We would do something with the data here */
select @CurrColumn1=@Column1
,@CurrID=@ID
end
Both of those TOP 1 queries will bring about SEEKs rather than SCANs. It’s just unfortunate that we most likely have to do two SEEKs for all million rows in our loop. But hey, that’s life.

So let’s try that new TOP 1 code to process our million-row table in (Column1,ID) order. And let’s try our various other methods in (Column1,ID) order as well. The code to use the various types of cursors (STATIC, KEYSET, DYNAMIC, and FAST_FORWARD) and our T-SQL code that emulates KEYSET and STATIC cursors are exactly the same as in Part 1, except for changing the ORDER BY clause.

Here are the figures:

/*
Description of Method CPU Reads Writes Duration
---------------------------------------------------------------------------
CURSOR Approaches (LOCAL FORWARD_ONLY):
STATIC READ_ONLY 29437ms 6,069,727 11,817 33469ms <--Winner
KEYSET READ_ONLY 37406ms 8,782,014 2,110 63812ms
DYNAMIC READ_ONLY 37651ms 7,006,216 0 68462ms
FAST_FORWARD READ_ONLY 37734ms 7,006,216 0 69064ms
Non-CURSOR Approaches:
Emulating KEYSET CURSOR 35125ms 6,014,954 2,609 64764ms
Emulating STATIC CURSOR 28437ms 3,039,600 12,377 39221ms
TOP 1 [Kind of emulates DYNAMIC] 64453ms 9,223,658 0 90114ms
*/
Wow! Even though our TOP 1 approach was the CPU-based winner when we processed the table in clustered index key order, it’s the biggest loser (by far) when we process the table in a nonclustered key order. And it’s the biggest loser in terms of Reads and Duration as well. It’s because of the double-SEEK and the Key Lookup that we had to do a million times. Of course, you could INCLUDE Column2 in the nonclustered index to eliminate the Key Lookup, but the other approaches worked just fine without us having to change the index.

Once again, the STATIC cursor approach is the Duration winner. The CPU winner this time is the T-SQL code that we wrote to emulate a STATIC cursor. It also has the lowest number of Reads. Hmmmmm…

One important side note: You may recall from Part 1 of this series that the FAST_FORWARD cursor is not a special type of cursor at all, but rather it’s an indicator to the optimizer to choose what it thinks is the most cost-effective cursor type for us. In this case (as was the case with processing our table in clustered key order), the optimizer chose to run it as a DYNAMIC cursor… you can see the similarities in all the measurements between the two.

So processing the table in a nonclustered index key order changed the standings a bit, didn’t it?

Processing in Non-Indexed Order

Now what if we process the table in order of a column that has no index at all… by (Column2,ID)?

Well, that eliminates our TOP 1 approach. We can’t possibly access the table one row at a time unless we have an index to work with somehow. Well, it is possible, but it would mean doing a SCAN of the entire table looking for the next highest value… one million times! It would take forever and a day.

But, all our other approaches will process the table just fine… it’s just a matter of changing the ORDER BY clauses so they process the table in (Column2,ID) order. And here are the results:

/*
Description of Method CPU Reads Writes Duration
---------------------------------------------------------------------------
CURSOR Approaches (LOCAL FORWARD_ONLY):
STATIC READ_ONLY 29609ms 6,069,727 11,817 33063ms <--Winner
KEYSET READ_ONLY 43109ms 8,791,922 2,111 45806ms
DYNAMIC READ_ONLY 42828ms 8,791,924 2,111 45966ms
FAST_FORWARD READ_ONLY 29672ms 6,069,741 11,820 33073ms
Non-CURSOR Approaches:
Emulating STATIC CURSOR 28406ms 3,039,772 12,378 40183ms
Emulating KEYSET CURSOR 39796ms 6,024,860 2,605 45187ms
TOP 1 [Kind of emulates DYNAMIC] N/A N/A N/A N/A
*/
Once again, as always, the STATIC cursor is the Duration winner and the T-SQL Code that emulates the STATIC cursor is the Reads and CPU winner.

But here are a couple of really interesting things…

You may recall that a DYNAMIC cursor, unlike the KEYSET and STATIC cursors, will attempt to read from a table directly as opposed to populating a temp table up front. Well, since we were accessing the table in order of an unindexed column, it was impossible to access the table directly. And so the optimizer changed the DYNAMIC cursor to a KEYSET cursor… you can see the similarities in measurements between the two. You can also see evidence of this if you take the following command that DECLAREs the DYNAMIC CURSOR…

declare c cursor 
local forward_only dynamic read_only
for
select ID,Column1,Column2
from TestTable
order by Column2,ID
…and look at the Estimated Execution Plan for it:

DYNAMIC Cursor Changed to KEYSET Cursor

Another interesting thing to note about our figures this time is that in the case of the FAST_FORWARD cursor, the optimizer chose a STATIC cursor approach for it (as opposed to a DYNAMIC approach as it did in the last two tests). Again, look at the similarities of its figures and the STATIC cursor’s figures.

The Best Approach

So let’s summarize the winners in our various processing orders:

/*
Winner Clustered Index Order NonClustered Index Order Non-Indexed Order
------------------------------------------------------------------------------------
Duration STATIC Cursor STATIC Cursor STATIC Cursor
Reads DYNAMIC Cursor Emulating STATIC Emulating STATIC
CPU TOP 1 [Emulating DYNAMIC] Emulating STATIC Emulating STATIC
*/
The STATIC Cursor was the winner in all processing orders in terms of Duration. But that was on my particular standalone system. If you go strictly by CPU time, the TOP 1 approach was best, but only when processing the table in clustered index key order. Otherwise the code we wrote to emulate a STATIC cursor is the CPU winner, and also the winner in terms of Logical Reads.

But here’s the interesting part that I want you to think about. These tests were all conducted in SQL2008. If I were to conduct the same tests in SQL2005, the results would come out like this instead:

/*
Winner Clustered Index Order NonClustered Index Order Non-Indexed Order
------------------------------------------------------------------------------------
Duration STATIC Cursor STATIC Cursor STATIC Cursor
Reads DYNAMIC Cursor STATIC Cursor STATIC Cursor
CPU TOP 1 [Emulating DYNAMIC] STATIC Cursor STATIC Cursor
*/
Why is this? What changed in SQL2008?

You’ll have to wait for Part 3 to find out, but here’s a clue. Check out the Logical Reads and CPU time in SQL2008 and SQL2005 when processing the table in Clustered Index Key order:

/*
Description CPU Reads
----------------------------------------------
SQL2008:
STATIC Cursor 23906ms 6,061,368
Emulating STATIC Cursor 23849ms 3,031,241 (Why is this half the reads???)
SQL2005:
STATIC Cursor 22378ms 6,107,958
Emulating STATIC Cursor 25402ms 6,128,352 (Reads are on par, but CPU higher)
*/
I’ll let you chew on that until next time.

Sunday, May 16, 2010

The Truth About Cursors: Part 1

The CURSORs are comin'!!!Oh my God! CURSORs are comin’!

Are we going to let ’em set foot in this town?

Hell No!!!

We don’t want their kind ’round these parts!

We gotta protect our wives and kin!

So grab yer pitchforks and torches! We ain’t gonna stand for it anymore! Let’s teach ’em a thing or two!

Kill the beasts!


I wanted to open this blog article with the same kind of flavor that I’ve seen in most blog posts regarding cursors. In other words: They are bad… they are evil… they are tools of the Devil! That’s all there is to it. Don’t ever use them under any circumstances or else you will burn in Hell.

Yes, of course a set-based approach is the preferred way to approach a problem… if a set-based approach can be found. Sometimes there are business problems that can only be solved by processing a row at a time, and that’s where cursors come into play. Itzik Ben-Gan gives a very mature argument about this in his T-SQL Programming book from the Inside SQL Server series. But there are still many out there who have such a hatred and/or phobia of cursors that they will trash them in their blogs.

Here’s what they will typically do… A demonstration of why cursors are bad. Okay, here it goes…

Create a table with a million rows (with a primary key clustered index):

use TestDB
go
if
object_ID('TestTable','U') is not null drop table TestTable
go
create
table TestTable
(
ID int identity(1,1) primary key
,Column1 varchar(50)
,Column2 varchar(50)
)
go

with

L0
(c) as (select 0 from (values (0),(0),(0)) x(c)) /* 3 Rows */
,L1(c) as (select 0 from L0 a,L0 b,L0 c) /* 27 Rows=3x3x3 */
,L2(c) as (select 0 from L1 a,L1 b,L1 c) /* 19683 Rows=27x27x27 */
,L3(c) as (select 0 from L2 a,L2 b) /* 387,420,489 Rows=19683x19683 */
,NN(n) as (select row_number() over (order by (select 0)) from L3)
insert TestTable (Column1,Column2)
select newid(),newid()
from NN
where n<=1000000
Now let’s put together some code to use a cursor to go through those million rows one row at a time in clustered key order:

declare @ID int
,@Column1 varchar(50)
,@Column2 varchar(50)
declare c cursor
for select ID,Column1,Column2
from TestTable
order by ID
open c
while 1=1
begin
fetch c into @ID,@Column1,@Column2
if @@fetch_status<>0 break
/* We would do something with the data here */
end
close
c
deallocate c
And now let’s show our superiority by putting together some code to read the rows one at a time in a non-cursor based mode. In fact, we’ll do it in a dumb way by retrieving the next ID in the clustered index using a MIN() aggregate and then, once we have that, we’ll use that ID to lookup the entire row’s columns. Of course, we could get all the row’s columns in a single SQL statement (using TOP instead of a MIN() aggregate), but we’ll do it in this inefficient way just to prove a point:

declare @ID int
,@Column1 varchar(50)
,@Column2 varchar(50)
declare @CurrID int
,@NextID int
select
@CurrID = -2147483648 /* Initialize to lowest possible ID */
while 1=1
begin
/* Get Next Sequential ID */
select @NextID=(select min(ID)
from TestTable
where ID>@CurrID)
if @NextID is null break
/* Retrieve row */
select @ID=ID
,@Column1=Column1
,@Column2=Column2
from TestTable
where ID=@NextID
/* We would do something with the data here */
select @CurrID=@ID /* Save Current ID */
end
Now how does that pathetic cursor compare to our far superior code?

/*
Description of Method CPU Reads Writes Duration
------------------------------------------------------------------------
CURSOR Approach 46120ms 4,011,375 0 52210ms
Non-CURSOR Approach using MIN(ID) 39750ms 6,011,372 0 46021ms <--Winner
*/
Here’s the part where we look down our noses and laugh hysterically and point to the bad performance of the cursor and say, “See? I told you. Cursors really suck!”

There… I’ve given you a synopsis of hundreds of blog articles that have been posted over the last umpteen years.

Here’s the part they left out, though. (They didn’t leave it out on purpose… they just didn’t dig deep enough).

Go back to the cursor code and add one single keyword to the cursor declaration… the word STATIC… and run it again:

declare @ID int
,@Column1 varchar(50)
,@Column2 varchar(50)
declare c cursor static
for
select ID,Column1,Column2
from TestTable
order by ID
open c
while 1=1
begin
fetch c into @ID,@Column1,@Column2
if @@fetch_status<>0 break
/* We would do something with the data here */
end
close
c
deallocate c
Now how does that compare to our other tests?

/*
Description of Method CPU Reads Writes Duration
------------------------------------------------------------------------
CURSOR Approach (No Keywords) 46120ms 4,011,375 0 52210ms
CURSOR Approach (STATIC) 23906ms 6,061,368 11,817 25068ms <--Winner
Non-CURSOR Approach using MIN(ID) 39750ms 6,011,372 0 46021ms
*/
Who’s laughing now? Which approach is fastest now? Huh?

Okay, let’s be fair. Let’s make our non-cursor based approach a little more intelligent by doing a TOP 1 instead of the inefficient MIN(ID) approach:

declare @ID int
,@Column1 varchar(50)
,@Column2 varchar(50)
declare @CurrID int
select
@CurrID = -2147483648 /* Initialize to lowest possible ID */
while 1=1
begin
select top 1 @ID=ID
,@Column1=Column1
,@Column2=Column2
from TestTable
where ID>@CurrID
order by ID
if @@rowcount=0 break
/* We would do something with the data here */
select @CurrID=@ID /* Save Current ID */
end
Now how does everything measure up?

/*
Description of Method CPU Reads Writes Duration
------------------------------------------------------------------------
CURSOR Approach (No Keywords) 46120ms 4,011,375 0 52210ms
CURSOR Approach (STATIC) 23906ms 6,061,368 11,817 25068ms <--Winner
Non-CURSOR Approach using MIN(ID) 39750ms 6,011,372 0 46021ms
Non-CURSOR Approach using TOP 1 20286ms 3,011,368 0 27137ms
*/
Which approach is fastest? Huh? Come on, you can say it. It won’t kill you. That’s right. The STATIC cursor approach is the fastest.

In order to understand why the STATIC cursor outperformed the other approaches, we have to look at cursors more closely and see how they work under the hood. Cursors are defined by scope (LOCAL or GLOBAL), by direction (FORWARD_ONLY or SCROLL), by type (STATIC, KEYSET, DYNAMIC, and FAST_FORWARD) , and by concurrency (READ_ONLY, SCROLL_LOCKS, and OPTIMISTIC). I only want to concentrate on the latter two: type and concurrency.

Let’s look at the types of cursors first, but for simplicity’s sake, we will look at them only with a READ_ONLY concurrency for now. A little later in this article, we will see how the other concurrency settings change things. The cursors we test out below will also be defined as LOCAL in scope and FORWARD_ONLY in direction in our testing.

STATIC Cursors

A STATIC cursor makes a copy of the data (i.e. the columns we specified in the DECLARE CURSOR command) into a temporary clustered index table in TempDB called CWT_PrimaryKey behind the scenes before it does any FETCHing at all. (I presume that CWT stands for Cursor Work Table). When we do FETCH from the cursor, the data comes from that temporary clustered index and NOT from the original table. You can see this by executing the following code, which just does an OPEN and a single FETCH…

declare @ID int
,@Column1 varchar(50)
,@Column2 varchar(50)
declare c cursor local forward_only static read_only
for
select ID,Column1,Column2
from TestTable
order by ID
open c
fetch c into @ID,@Column1,@Column2
close c
deallocate c
… and now look at the Actual Execution Plans for the OPEN and FETCH:

STATIC READ_ONLY Cursor OPEN and FETCH

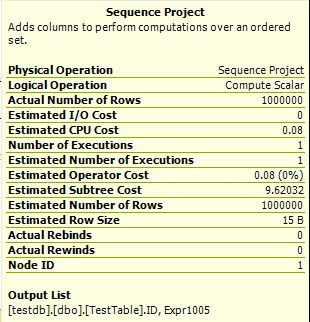
Looking at the properties of the Sequence Projection Operator of the OPEN plan, we can see in the Output List that all of the columns get fed to the Clustered Index Insert Operator:

STATIC Cursor Columns

And in the FETCH plan, we can see that the data we retrieve comes directly from that CWT_PrimaryKey temp table and no longer touches the original table at all.

Notice the Segment Operator and the Sequence Projection Operator in OPEN plan? That indicates a window function… specifically a ROW_NUMBER() calculation (that's the Expr1005 column in the Output List). I can duplicate this same thing in T-SQL like so:

if object_ID('tempdb..#CWT_PrimaryKey','U') is not null drop table #CWT_PrimaryKey
create table #CWT_PrimaryKey (SeqNo bigint primary key
,ID int
,Column1 varchar(50)
,Column2 varchar(50))
insert #CWT_PrimaryKey
select SeqNo=row_number() over (order by ID)
,ID=ID
,Column1
,Column2
from TestTable
And here is the Actual Plan for that… Notice the similarity with the STATIC cursor’s OPEN plan:

Plan for a STATIC Cursor Emulation

(If you’re wondering about the TOP operator, it’s a ROWCOUNT Top… it just makes sure that any SET ROWCOUNT setting is honored when INSERTing rows into the temp table.)

In fact, we can write T-SQL code to process our million-row TestTable, emulating the behavior of a STATIC cursor:

if object_ID('tempdb..#CWT_PrimaryKey','U') is not null drop table #CWT_PrimaryKey
create table #CWT_PrimaryKey (SeqNo bigint primary key
,ID int
,Column1 varchar(50)
,Column2 varchar(50))
insert #CWT_PrimaryKey
select SeqNo=row_number() over (order by ID)
,ID=ID
,Column1
,Column2
from TestTable

declare @SeqToFetch int
set
@SeqToFetch=0
while 1=1
begin
set @SeqToFetch=@SeqToFetch+1
select @ID=ID
,@Column1=Column1
,@Column2=Column2
from #CWT_PrimaryKey
where SeqNo=@SeqToFetch
if @@rowcount=0 break
/* We would do something with the data here */
end

drop table #CWT_PrimaryKey
How does this compare with all the other methods so far in processing the million-row table?:

/*
Description of Method CPU Reads Writes Duration
---------------------------------------------------------------------------
CURSOR Approaches:
No Keywords Specified 46120ms 4,011,375 0 52210ms
STATIC READ_ONLY 23906ms 6,061,368 11,817 25068ms <--Winner
Non-CURSOR Approaches:
MIN(ID) 39750ms 6,011,372 0 46021ms
TOP 1 20286ms 3,011,368 0 27137ms
Emulating STATIC CURSOR 23849ms 3,031,241 12,376 33659ms
*/
So, even though we’ve written code to do exactly what a STATIC cursor does, the cursor itself is still faster. Hmmm…

KEYSET Cursors

A KEYSET cursor is similar to a STATIC one in the sense that it creates a temporary clustered index table of values behind the scenes. But this time, it only contains the column(s) that make up the primary key to the original table and ignores the rest of the columns. When we do a FETCH from a KEYSET cursor, it retrieves those primary key column(s) from the CWT_PrimaryKey temp table and uses that to do a lookup into the original table to get the rest of the columns that we requested.

Here’s what the Actual Execution Plan looks like for a KEYSET cursor when we OPEN it and FETCH one row:

KEYSET READ_ONLY Cursor OPEN and FETCH

The OPEN plan looks exactly like the STATIC cursor’s OPEN plan. The only difference is what gets put into the CWT_PrimaryKey temp table. Notice that the only columns being fed to the Clustered Index Insert Operator are the ID (the original table’s Primary Key) and the ROW_NUMBER() value that the Sequence Projection Operator created:

KEYSET CURSOR Columns

Again, we can write code to emulate the behavior of a KEYSET cursor:

declare @ID int
,@Column1 varchar(50)
,@Column2 varchar(50)

if object_ID('tempdb..#CWT_PrimaryKey','U') is not null drop table #CWT_PrimaryKey
create table #CWT_PrimaryKey (SeqNo bigint primary key
,ID int)
insert #CWT_PrimaryKey
select SeqNo=row_number() over (order by ID)
,ID=ID
from TestTable

declare @SeqToFetch int
set
@SeqToFetch=0
while 1=1
begin
set @SeqToFetch=@SeqToFetch+1
select @ID=ID
,@Column1=Column1
,@Column2=Column2
from TestTable
where ID=(select ID from #CWT_PrimaryKey where SeqNo=@SeqToFetch)
if @@rowcount=0 break
/* We would do something with the data here */
end

drop table #CWT_PrimaryKey
Now let’s collect Profiler statistics on both the KEYSET cursor and our code that emulates it and see how they compare to all our other approaches so far in processing our million-row table:

/*
Description of Method CPU Reads Writes Duration
---------------------------------------------------------------------------
CURSOR Approaches:
No Keywords Specified 46120ms 4,011,375 0 52210ms
STATIC READ_ONLY 23906ms 6,061,368 11,817 25068ms <--Winner
KEYSET READ_ONLY 36578ms 8,787,165 2,110 38158ms
Non-CURSOR Approaches:
MIN(ID) 39750ms 6,011,372 0 46021ms
TOP 1 20286ms 3,011,368 0 27137ms
Emulating STATIC CURSOR 23849ms 3,031,241 12,376 33659ms
Emulating KEYSET CURSOR 34297ms 6,020,084 2,608 39571ms
*/
Hmmm…

DYNAMIC Cursors

We’ve seen that STATIC and KEYSET cursors have a population phase where a temp table is loaded with some information when the cursor is OPENed. DYNAMIC cursors do not create any temp table, but rather read directly from the original table.

The Actual Execution Plan for OPENing a DYNAMIC READ_ONLY cursor and FETCHing one row looks like this:

DYNAMIC READ_ONLY Cursor OPEN and FETCH

So the OPEN doesn’t really do anything plan-wise at all. The FETCH just retrieves its information directly from the source table based on an internal record pointer. The Compute Scalar Operator is just computing a constant value of 1. To be honest, I don’t know what that is for… perhaps it’s just a flag of some kind indicating that this is a DYNAMIC cursor FETCH.

The closest we can come to emulating a DYNAMIC cursor’s behavior is using the method we demonstrated already towards the beginning of this article… by doing a SELECT TOP 1 WHERE ID>@CurrID in a loop.

So how does the DYNAMIC cursor do in processing our million-row table:

/*
Description of Method CPU Reads Writes Duration
---------------------------------------------------------------------------
CURSOR Approaches:
No Keywords Specified 46120ms 4,011,375 0 52210ms
STATIC READ_ONLY 23906ms 6,061,368 11,817 25068ms <--Winner
KEYSET READ_ONLY 36578ms 8,787,165 2,110 38158ms
DYNAMIC READ_ONLY 24270ms 1,011,368 0 29539ms
Non-CURSOR Approaches:
MIN(ID) 39750ms 6,011,372 0 46021ms
Emulating STATIC CURSOR 23849ms 3,031,241 12,376 33659ms
Emulating KEYSET CURSOR 34297ms 6,020,084 2,608 39571ms
TOP 1 [Kind of emulates DYNAMIC] 20286ms 3,011,368 0 27137ms
*/
Wow! The DYNAMIC cursor did really well compared to many of the other approaches. It comes in 3rd place in terms of duration, just behind our SELECT TOP 1 approach and the STATIC cursor, which is still the front-runner.

FAST_FORWARD Cursors

Books Online states that FAST_FORWARD cursors are special cursors with “performance optimizations enabled.” In reality, from what I can tell, a FAST_FORWARD cursor is really not its own type of cursor at all. The Optimizer actually makes a judgement call and decides which of the other three cursor types (STATIC or KEYSET or DYNAMIC) to use… in other words, it makes the decision for you.

Here’s the Actual Execution Plan for a FAST_FORWARD cursor when we OPEN it and FETCH one row:

FAST_FORWARD Cursor OPEN and FETCH

It’s exactly like the DYNAMIC cursor’s plan, except it doesn’t have that mysterious Compute Scalar Operator.

And, sure enough, if we run a FAST_FORWARD cursor on our million-row table, its statistics are practically a clone of the DYNAMIC cursor’s statistics:

/*
Description of Method CPU Reads Writes Duration
---------------------------------------------------------------------------
CURSOR Approaches (LOCAL FORWARD_ONLY):
No Keywords Specified 46120ms 4,011,375 0 52210ms
STATIC READ_ONLY 23906ms 6,061,368 11,817 25068ms <--Winner
KEYSET READ_ONLY 36578ms 8,787,165 2,110 38158ms
DYNAMIC READ_ONLY 24270ms 1,011,368 0 29539ms
FAST_FORWARD READ_ONLY 24328ms 1,011,368 0 29632ms
Non-CURSOR Approaches:
MIN(ID) 39750ms 6,011,372 0 46021ms
Emulating STATIC CURSOR 23849ms 3,031,241 12,376 33659ms
Emulating KEYSET CURSOR 34297ms 6,020,084 2,608 39571ms
TOP 1 [Kind of emulates DYNAMIC] 20286ms 3,011,368 0 27137ms
*/
I imagine the DYNAMIC approach is chosen by the optimizer because it figures that it is more cost effective to not incur the overhead of the STATIC population of a temp table up front. However, the bottom line is that despite the number of Reads and Writes involved, the STATIC cursor still beats out all other approaches in terms of Duration.

So all of you who have blindly used FAST_FORWARD cursors may want to investigate whether a STATIC cursor might work better for you.

Cursor Concurrency

Now we will briefly discuss the 3 types of concurrency you can define for a cursor: READ_ONLY, SCROLL_LOCKS, and OPTIMISTIC.

A cursor that is READ_ONLY is self-explanatory. If we define a cursor as READ_ONLY, we cannot perform an UPDATE or DELETE through the cursor via the WHERE CURRENT OF clause of those commands.

If a cursor is defined with SCROLL_LOCKS, then any row that is FETCHed is automatically locked so that any subsequent UPDATE or DELETE will be guaranteed to succeed. Not only that… but when the row is FETCHed, its Current Row Pointer and Primary Key are inserted into our friend the CWT_PrimaryKey temp table.

This is because when we perform an UPDATE with the WHERE CURRENT OF clause, the system will SEEK into CWT_PrimaryKey based on the Current Row Pointer that the cursor is processing, and use the primary key that had been stored there to do a lookup into the original table, and then finally UPDATE the table.

If you run the following code to OPEN a DYNAMIC SCROLL_LOCKS cursor, FETCH one row, and then UPDATE a column for that row via the WHERE CURRENT OF clause…

declare @ID int
,@Column1 varchar(50)
,@Column2 varchar(50)
declare c cursor local forward_only dynamic scroll_locks
for
select ID,Column1,Column2
from TestTable
order by ID
open c
fetch c into @ID,@Column1,@Column2
update TestTable set Column1='XYZ' where current of c
close c
deallocate c
…here’s what the Actual Execution Plan looks like:

DYNAMIC SCROLL_LOCKS Cursor FETCH and UPDATE

So the UPDATE WHERE CURRENT OF is pretty much doing something like this:

update TestTable
set Column1='XYZ'
where ID=(select ID
from CWT_PrimaryKey
where RowID = <CurrentRowOfCursor>)
Now we get to an OPTIMISTIC cursor. Unlike SCROLL_LOCKS, an OPTIMISTIC cursor does not guarantee that subsequent UPDATEs or DELETEs will succeed. It does not lock the row that had just been FETCHed.

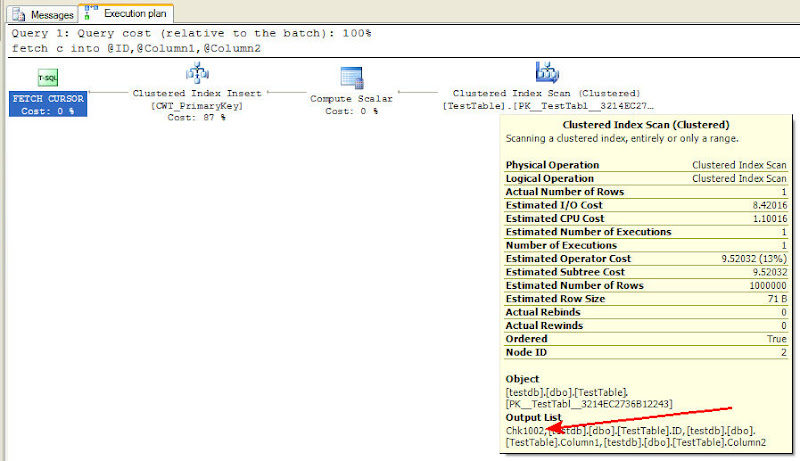
Like the SCROLL_LOCKS cursor, though, an OPTIMISTIC cursor saves the Current Row Pointer and Primary Key into the CWT_PrimaryKey temp table. But in addition to those, a CHECKSUM of all the columns of the row is calculated and stored in there as well. You can see this CHECKSUM value as a column being passed along from the original table:

OPTIMISTIC Cursor CHECKSUM Column

Then, when an UPDATE is done with the WHERE CURRENT OF clause, the system recalculates the CHECKSUM of the row in the original table and only performs the UPDATE if that value is equal to the one that had been stored in CWT_PrimaryKey. In other words, if some other connection successfully performed an UPDATE on the row between the time we FETCHed it and the time we attempted to UPDATE it, then we would get an error upon UPDATE because the CHECKSUM value changed during that time.

The pseudo-code for an UPDATE to a DYNAMIC OPTIMISTIC cursor, then, is something like this:

update TestTable
set Column1='XYZ'
where ID=(select ID
from CWT_PrimaryKey
where RowID = <CurrentRowOfCursor>)
and checksum(ID,Column1,Column2)=(select CheckSumValue
from CWT_PrimaryKey
where RowID = <CurrentRowOfCursor>)
if @@rowcount=0
begin
/* ERROR! */
end
I’ll leave it to you to investigate the Actual Execution Plan for this type of cursor.

Now Here’s What They Don’t Tell You

So you can see that an OPTIMISTIC cursor has to calculate a CHECKSUM on every single column and store it, along with some key information, into a CWT_PrimaryKey temp table for every single FETCH we perform, because it has to assume that we might want to subsequently perform an UPDATE or DELETE.

And guess what?

When you do a DECLARE CURSOR without specifying any keywords whatsoever, it defaults to a DYNAMIC OPTIMISTIC cursor!

All those blogs that demonstrate the crappy performance of cursors never declare the cursor with any keywords! So they end up using a DYNAMIC OPTIMISTIC one, which, as you now know, does a bunch of work. So is it any surprise that the performance is bad?

But now you know that a STATIC cursor can be the best performer… even better than the beloved FAST_FORWARD cursor… if you don’t mind the overhead of creating the temp table in TempDB.

All of our tests in this article involved accessing data in order of the primary key making up the clustered index of our table. In Part 2, we will see how the various types of cursors perform (and how our T-SQL equivalents perform) in accessing data in order of a non-clustered index column and in order of a non-indexed column.

Note: After doing my testing in preparation for this article on cursors, I came upon an article by MVP Hugo Kornelis that he wrote in 2007 that did similar testing on the various types of cursors. His findings coincided with mine. Check it out if you want to get a “sneak peek” at my findings in the second part of this series.